

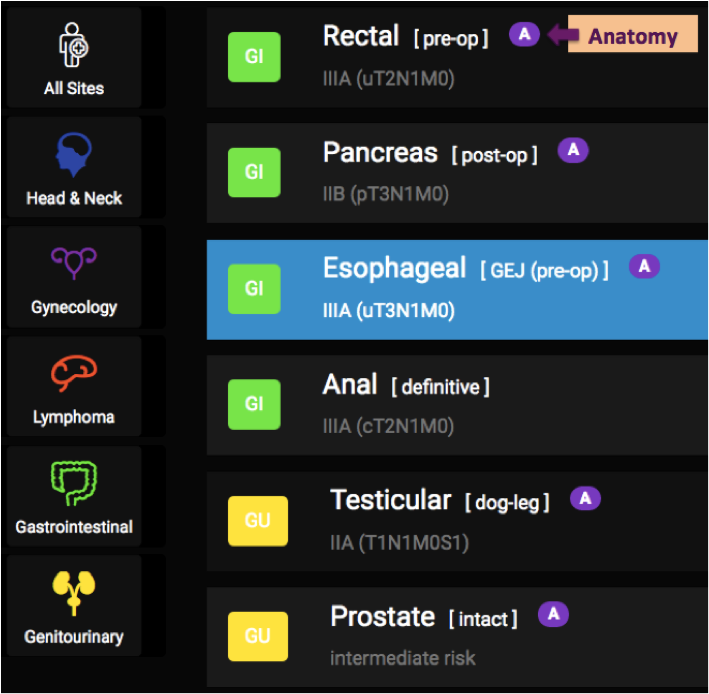
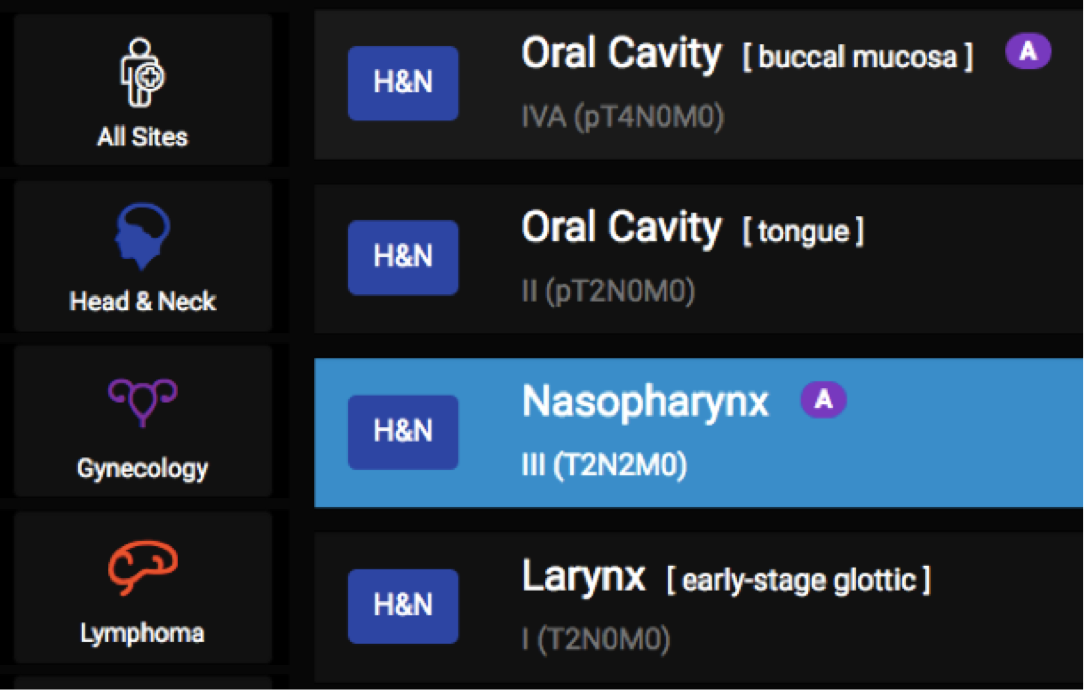
Oncologists often group cancers according to their anatomic location in the body, which we call disease sites in radiation oncology (ex. Gastrointestinal, or “GI”).
Within each disease site is a number of more specific groupings of cancer types, most often termed subsites (ex. “Rectal”). eContour currently presents the most common cancer types treated with radiation.
The next subdivision provided is based on:
We include the stage below for your reference. TIP: Patients treated post-operatively will have stage preceded by a “p” to represent “pathologic stage” (ie pT3N1M0 pancreas).
*DISCLAIMER: It is very important to recognize that every patient’s pathology is unique, and that the contours presented here serve as an example in 3D of an acceptable treatment strategy, rather than the exact contours for your patient. Details in the contouring descriptions and references can provide additional guidance for your specific case but ultimately appropriate contours are decision of treating MD.
Upon opening the case, the patient’s assessment (known informally as the “one-liner”) is provided – this may include histology, molecular markers, imaging and/or exam findings and prior treatment including margin status and detailed findings on pathology, each of which can impact radiation treatment decisions.
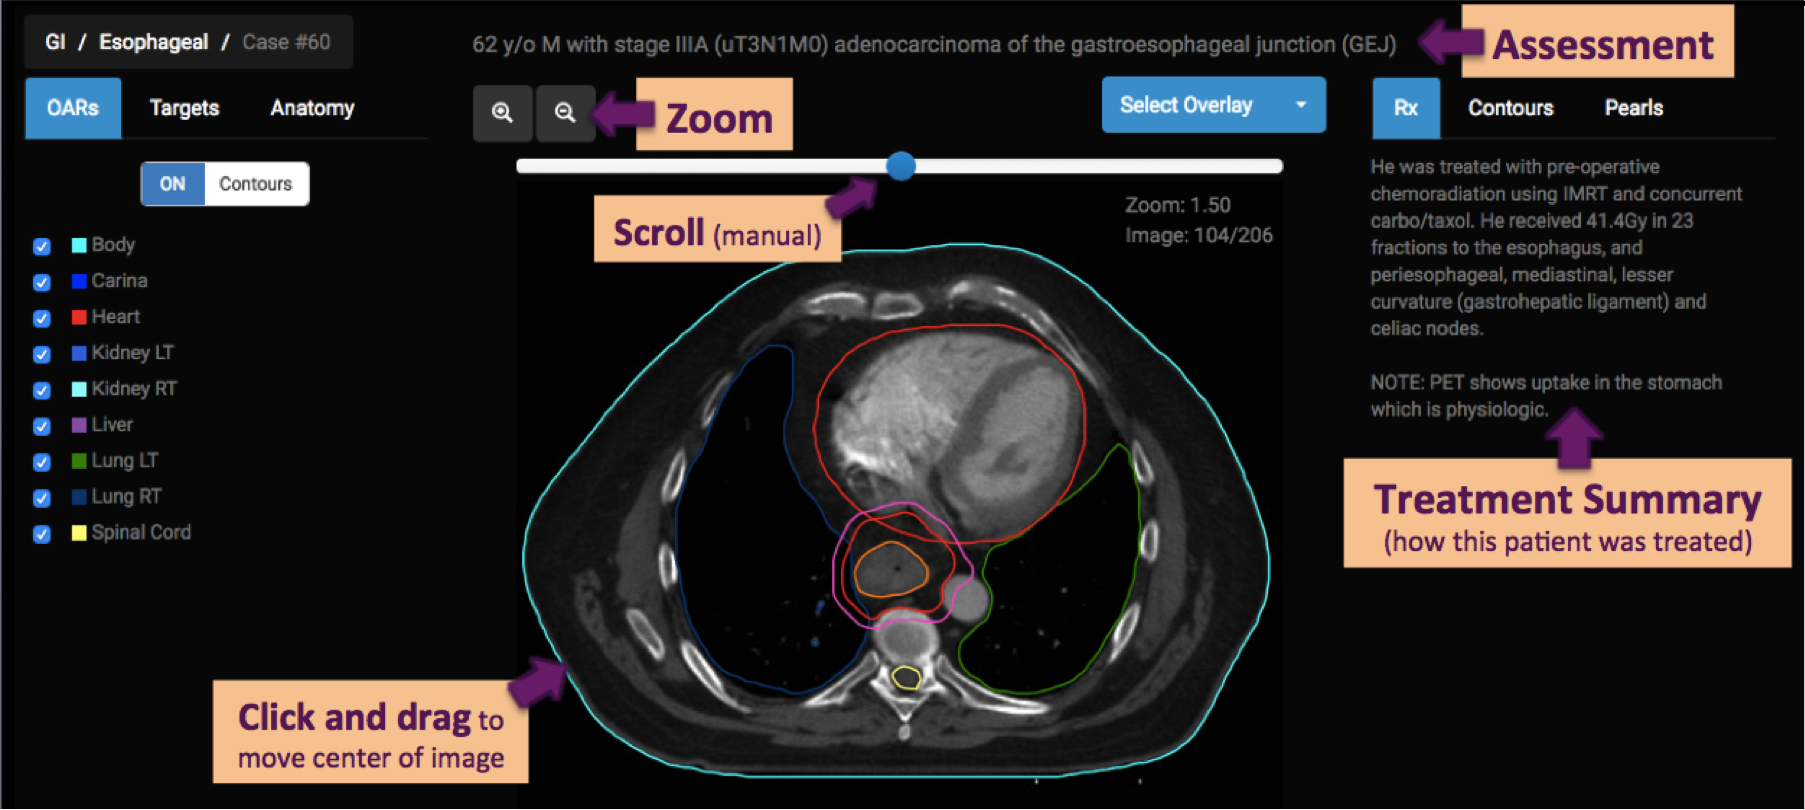
Each case displays a set of images from the simulation CT scan. You can scroll through the images using the manual scroll bar at the top of the screen or with your mouse’s scroll wheel. Magnify the image in your screen view using zoom in upper left of image. Once zoomed, click and drag the image to re-center on area of interest.
Each case displays a complete set of contours (also known as structures), which were created for radiation treatment planning, including both target volumes and organs at risk (OARs) of side effects from radiation. TIP: Contouring these 3D structures enables calculation of radiation dose to maximize tumor control and minimize normal tissue toxicity.
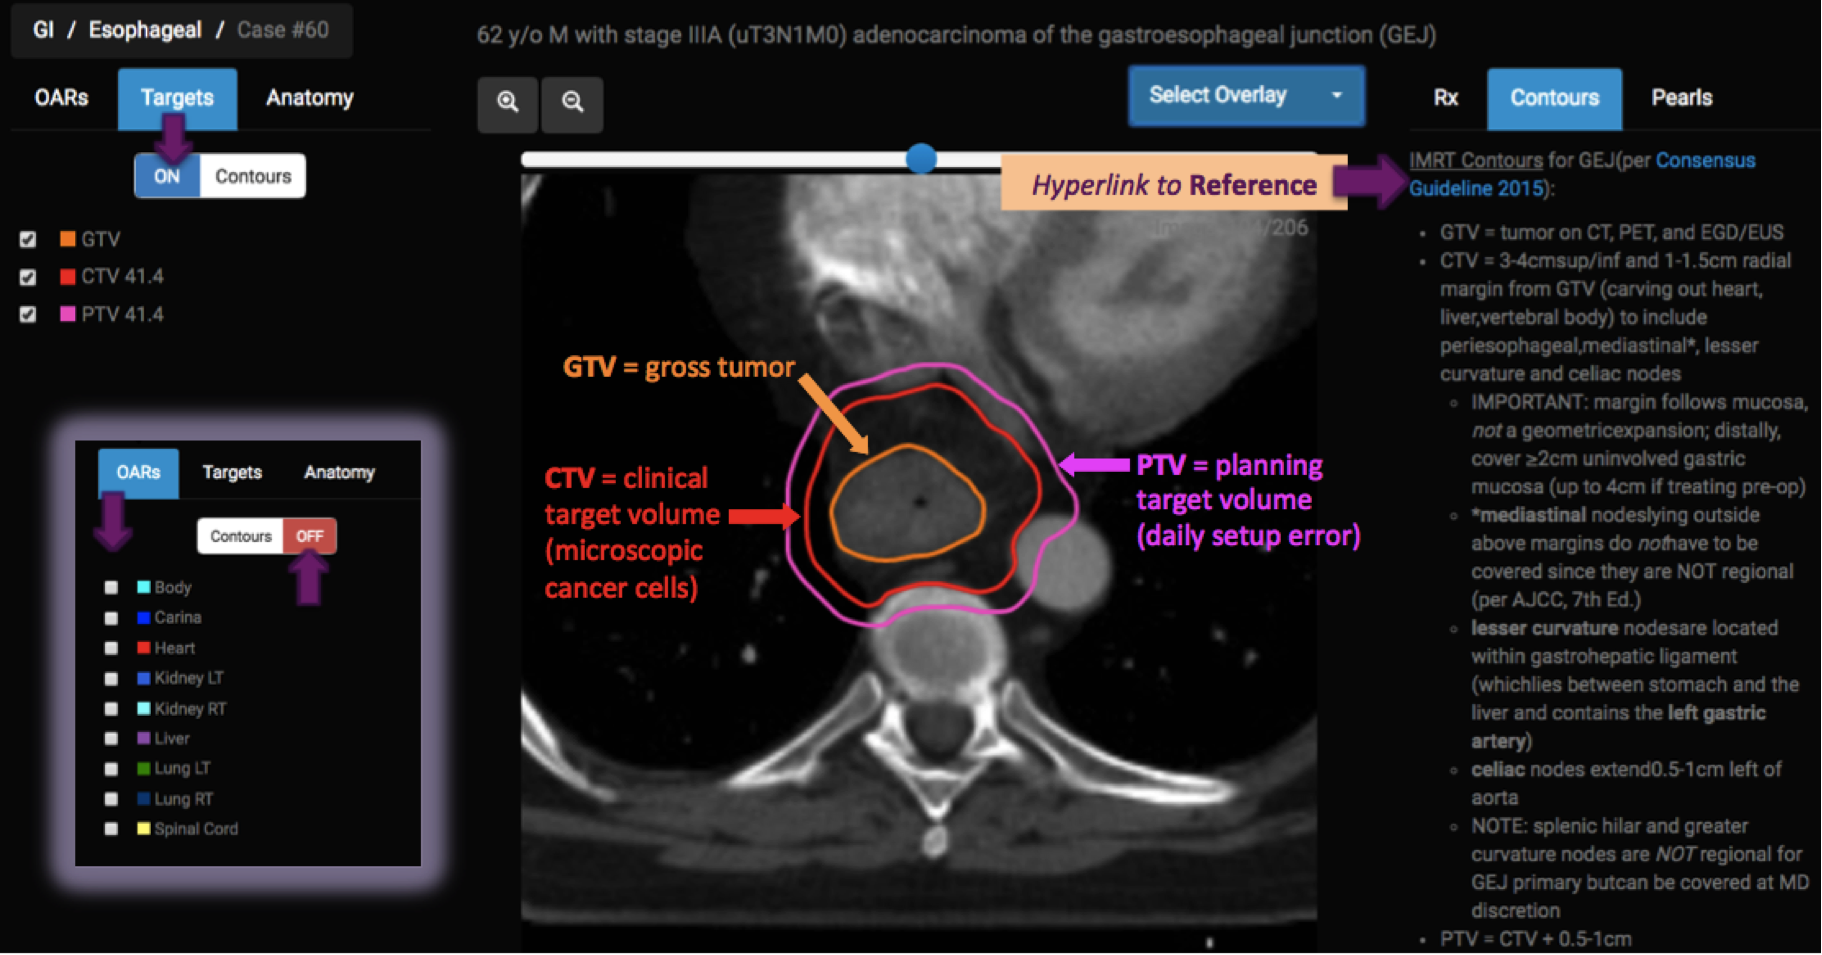
In this screenshot, all “OARs” have been turned OFF (notice heart, lungs, and spinal cord are no longer visible) and “Target Volumes” have been turned ON. The CTV demonstrates a radial margin not extending into heart or bone (which tumor will typically not invade). The PTV has a 5mm margin for setup error to ensure that if the patient moves within the upper body immobilization device (vac lock in this case), the tumor will still receive adequate dose.
The third tab of contours/structures is for “Anatomy” which represents radiographic anatomy that helps guide contour delineation. NOTE: These are not structures that require a dose calculation! They are simply included for education and guidance.
Rx (abbreviation for prescription) describes the treatment summary, including radiation treatment intent, prescribed dose and fractionation schedule, and treatment set up.
Contours includes evidence-based consensus guidelines (when available), clinical trial protocol guidelines, or peer-reviewed institutional publications describing technique and clinical outcomes.
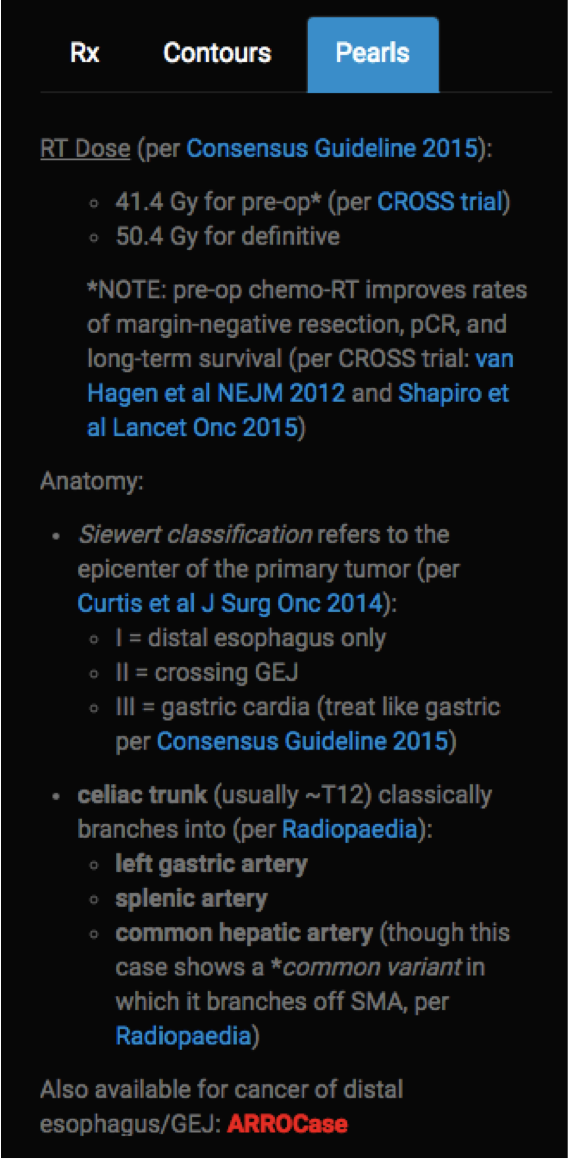
Pearls tab will often include some information regarding this anatomy and/or imaging for the case, in addition to high-yield management (especially decision-making at the time of treatment planning such as dose, fractionation, and concurrent systemic therapy). Links to ARROCases are included (when available) to supplement case-based general workup and management.
Let us now switch briefly to a case of nasopharyngeal carcinoma case to demonstrate image overlays.
At the upper right of the image frame the Select Overlay option allows you to overlay diagnostic images, such as MRI and PET, which have been fused to the simulation CT scan to aid contour delineation.
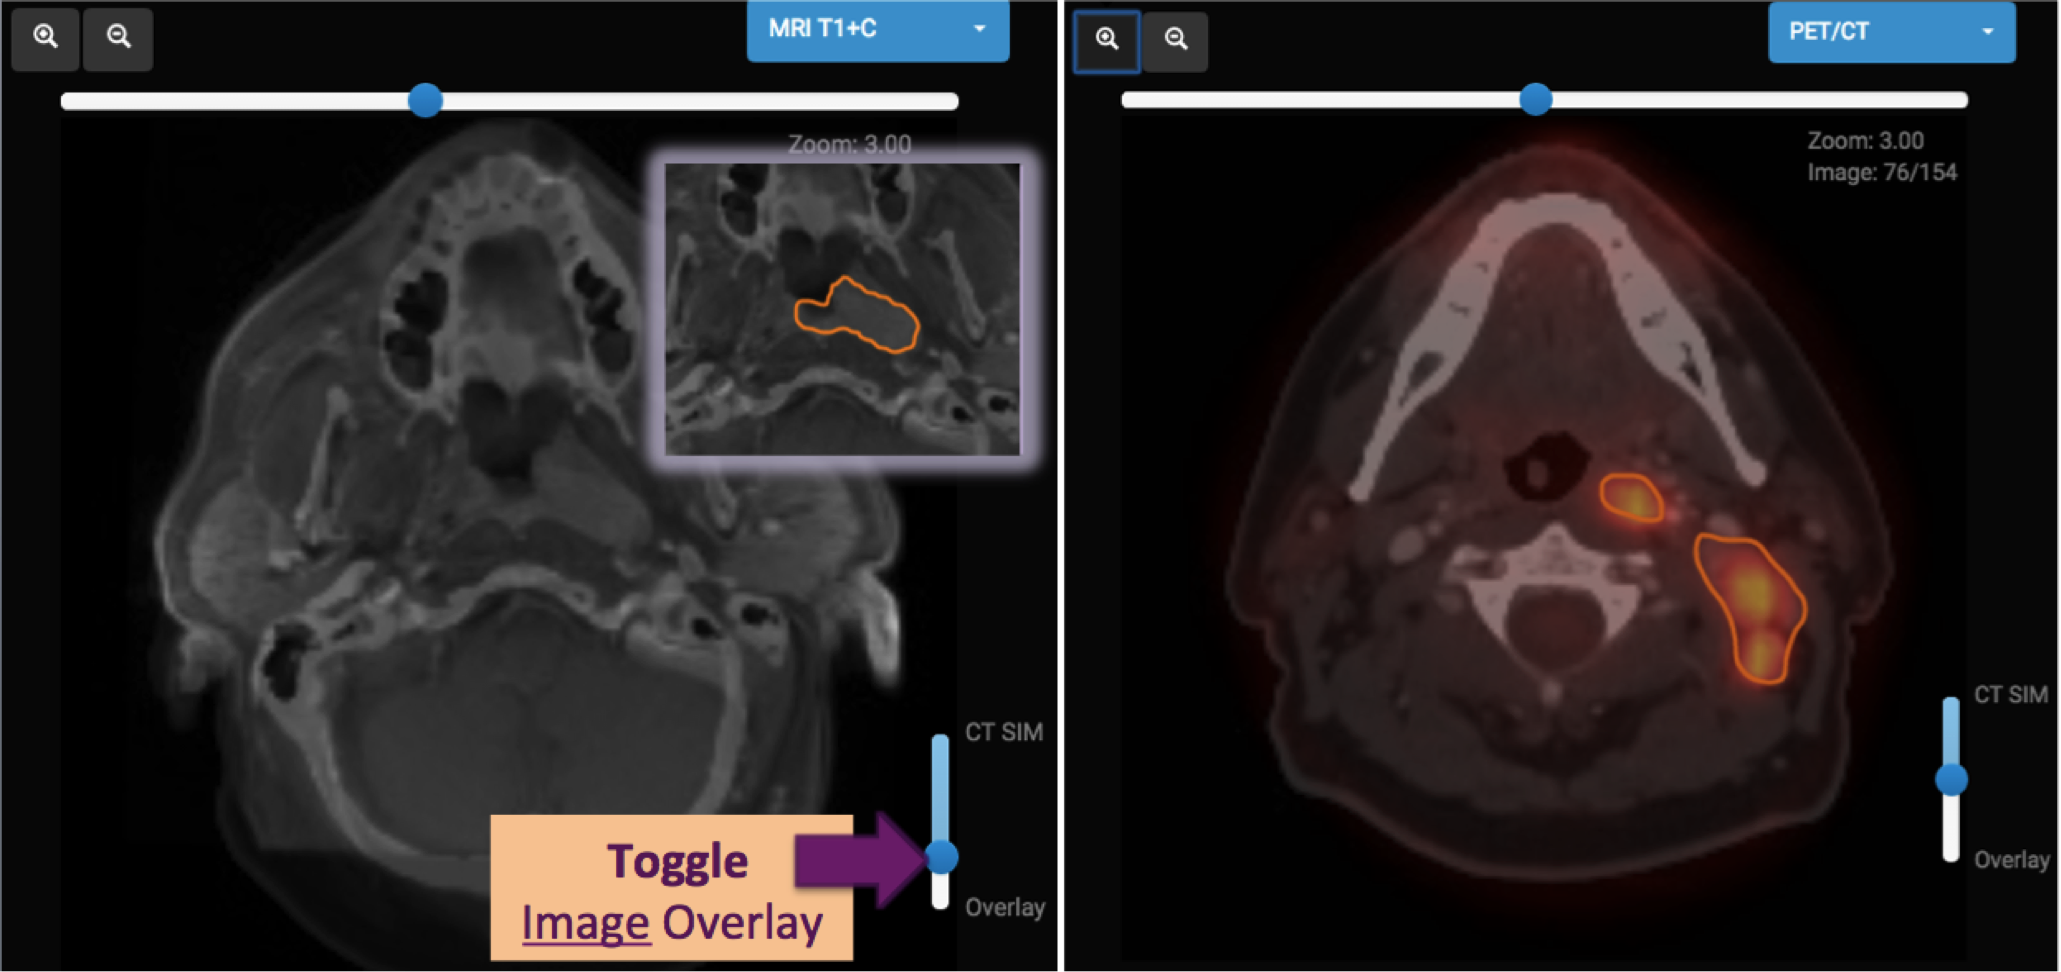
CONTOURING TIP: Overlaying MRI can help with soft tissue contrast, especially in identification of primary tumor.
CONTOURING TIP: Overlaying the PET scan can be particularly useful for differentiating positive lymph nodes from enlarged but reactive/inflammatory nodes. Always correlate PET positive areas with abnormal
soft tissue on CT because some normal tissues can have high metabolic activity that is physiologic, or normal (like the brain, tonsils, larynx).
Overlaying the RT Dose allows you to see what an acceptable radiation dose distribution looks like. You can move the dose threshold bar on the right to show only dose above a certain level.
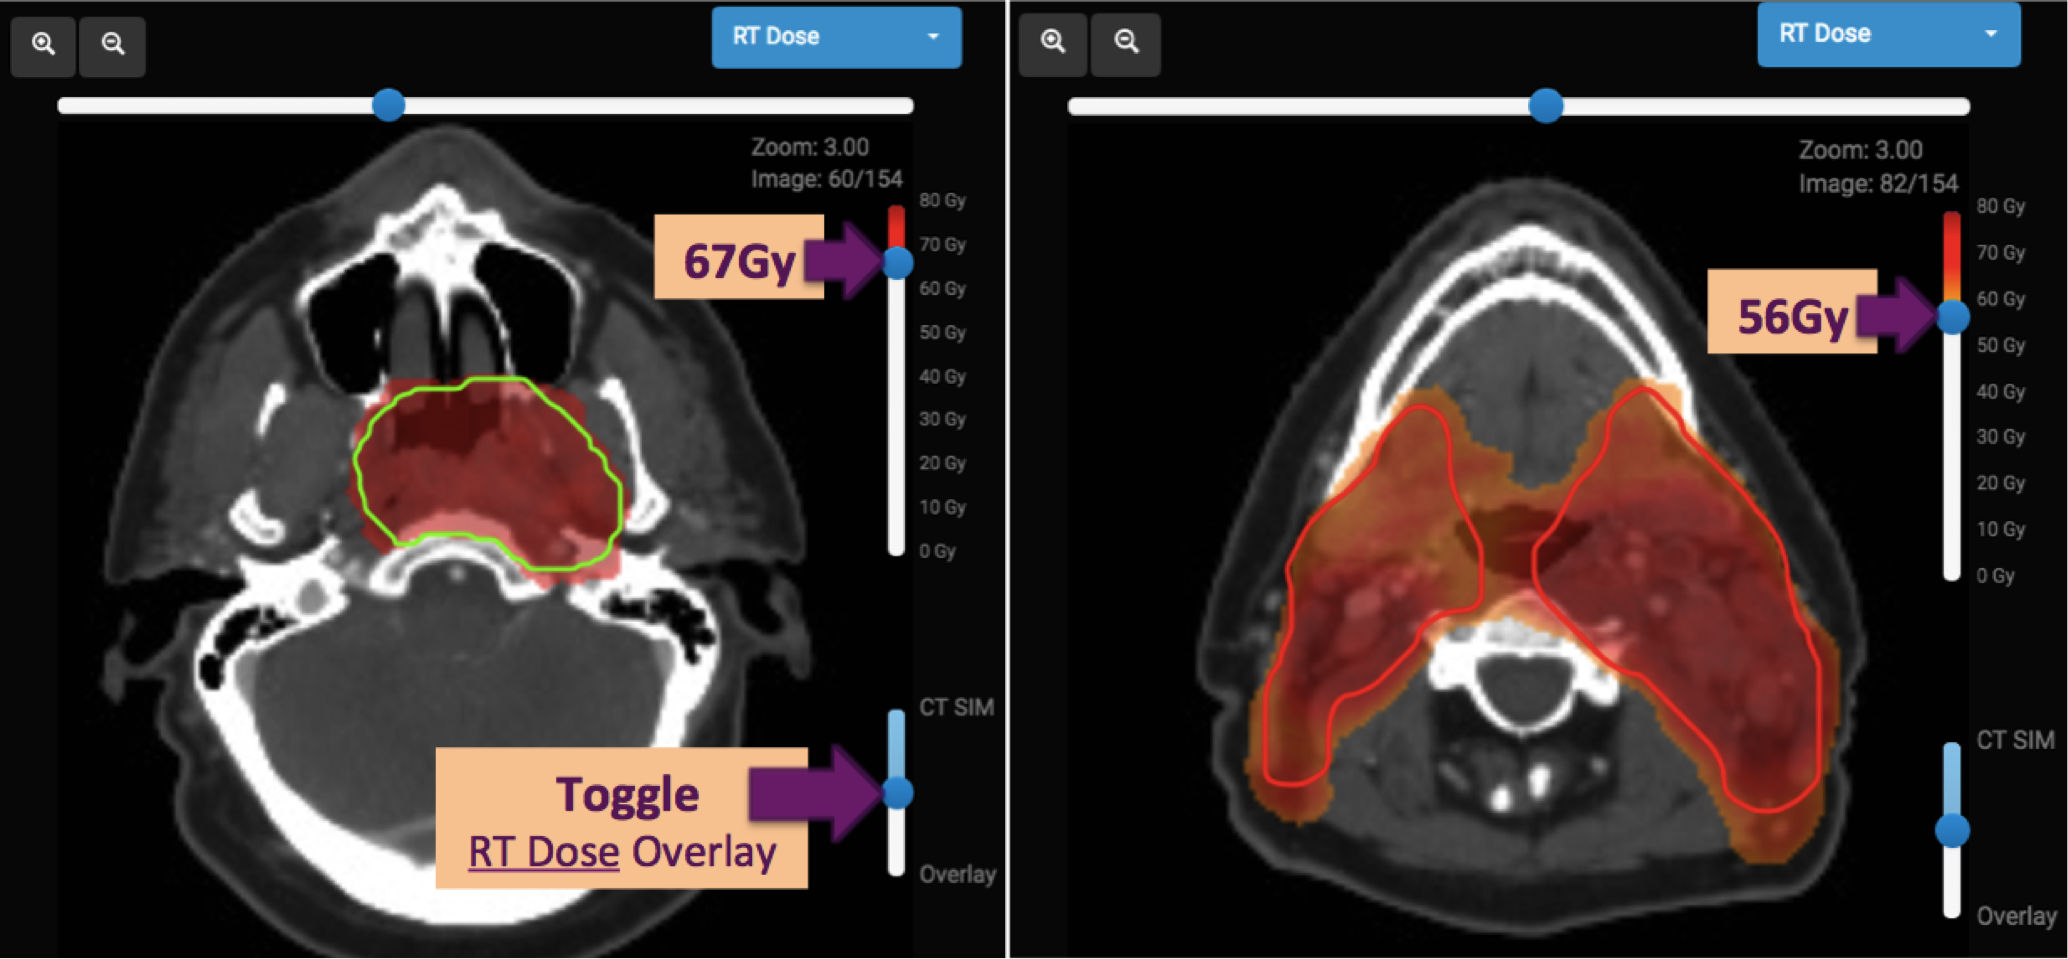
PLAN REVIEW TIP: It is often useful to look at the 95% isodose level (for PTV70, set the bar to 67Gy) to assess dose coverage and conformality (how well the radiation “conforms” to the prescribed volume or structure).
When evaluating a treatment plan, the dose-volume histogram plots dose (usually viewed in absolute = Gy) vs. volume (can be viewed in absolute = cc or cm3 or relative = % of whole organ). The “D95” most commonly refers to the volume (again,
either absolute cc or % of total) receiving 95% of the prescription dose (sometimes it will be written D95% to avoid confusion with D95Gy which would represent the volume receiving 95Gy).
PLAN REVIEW TIP: This is a simultaneous integrated boost (SIB) plan in which multiple dose levels were treated at the same time (70Gy/35=2.0Gy per fraction, 59.4Gy/35=1.7Gy per fraction). It is important to review
the conformality of EACH 95% isodose level.
Interactive contouring guidelines for the busy radiation oncology professional
Copyright eContour